Restaurant Peak Hour Analytics for Smarter Operations
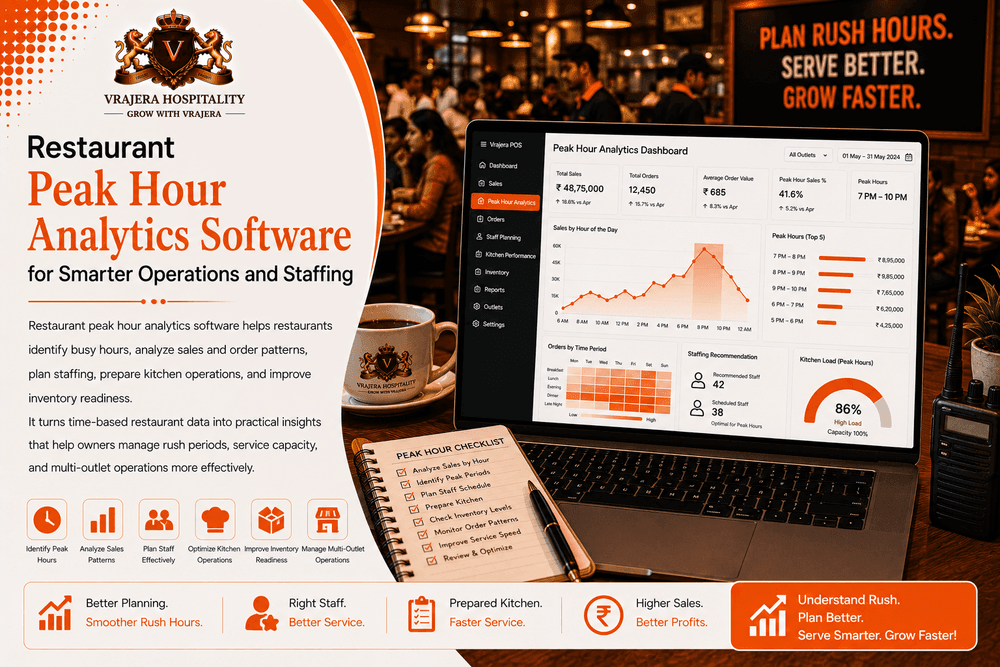
Restaurant peak hour analytics helps restaurant owners understand exactly when customer demand is highest and how those busy periods affect sales, orders, staffing, kitchen operations, and inventory.
Most restaurants do not experience equal demand throughout the day. A cafe may be busiest in the morning, a QSR during lunch, and a fine-dining restaurant during dinner. Weekend patterns may also be completely different from weekday demand.
When restaurants understand these patterns, they can prepare people, ingredients, tables, and kitchen capacity before the rush begins instead of reacting after operations become overloaded.
What Is Restaurant Peak Hour Analytics?
Restaurant peak hour analytics is the process of analyzing restaurant activity according to time periods to identify when demand increases or decreases.
Depending on available restaurant data, businesses can analyze:
- Sales by hour
- Orders by hour
- Average order value
- Table activity
- Menu demand
- Customer traffic patterns
- Kitchen workload
- Outlet-wise peak periods
The purpose is not simply to identify the busiest hour. Useful peak-hour analytics should help restaurants prepare operations around predictable demand.
Manual Observation vs Peak Hour Analytics
| Area | Manual Observation | Peak Hour Analytics |
|---|---|---|
| Busy Hours | Estimated | Data-Based |
| Sales by Time | Difficult to Compare | Organized |
| Order Volume | Manually Observed | Analyzed |
| Staffing Decisions | Experience Based | Data Supported |
| Kitchen Planning | Reactive | More Proactive |
| Multi-Outlet Comparison | Difficult | Centralized |
Identify Restaurant Peak Hours
The first step is understanding when restaurant demand is actually highest.
Hourly Sales Analysis
Restaurant owners can organize sales information by hour to identify periods that generate the highest revenue.
A busy period based on sales may not always be identical to the period with the highest number of orders, so both measures can provide useful context.
Order Volume by Time
Order volume shows how many transactions or orders occur during different periods.
High order volume can place pressure on:
- Order taking
- Kitchen preparation
- Billing
- Table service
- Delivery operations
Understanding this pattern helps management prepare more effectively.
Lunch and Dinner Rush Analysis
Restaurants can compare lunch and dinner activity separately rather than treating the full day as one operating period.
This can reveal significant differences in customer behaviour and operational requirements.
Weekday vs Weekend Peak Hours
Restaurant demand often changes according to the day of the week.
Weekday Demand
Office areas may experience strong weekday lunch demand, while residential locations may follow different patterns.
Weekend Demand
Weekend customers may arrive at different times, stay longer, order differently, or spend differently.
Compare Day-Level Patterns
Historical analytics can help restaurant managers identify recurring demand patterns across different days.
This gives scheduling and operations teams better information for planning.
Peak Hour Staffing Analytics
Workforce planning is one of the most useful applications of peak-hour analytics.
Match Staffing with Demand
Restaurants can use historical demand information as context when planning:
- Kitchen staff
- Service teams
- Cashiers
- Supervisors
- Delivery operations
- Other relevant employees
Reduce Understaffing
Too few employees during busy periods can contribute to slower operations, staff pressure, and weaker customer experiences.
Avoid Unnecessary Overstaffing
Using maximum staffing throughout the entire day may increase labor costs unnecessarily.
Better demand visibility helps managers plan workforce coverage according to expected operational requirements.
Combine Analytics with Management Judgment
Historical patterns are useful, but they cannot predict every situation.
Weather, festivals, events, promotions, and unexpected demand can change restaurant activity, so managers should use analytics as decision support rather than an automatic staffing rule.
Kitchen and Order Preparation Analytics
Peak demand affects the kitchen as much as the front of house.
Understand Kitchen Workload
Time-based order information can help management understand when the kitchen typically receives the highest workload.
Prepare Ingredients Before Rush Periods
Historical demand can provide useful context for preparation planning.
Restaurants may prepare relevant ingredients or production quantities before expected busy periods while still controlling freshness and wastage.
Menu Demand During Peak Hours
Certain products may sell more frequently during specific periods.
Understanding time-based menu demand can improve kitchen preparation and inventory readiness.
Improve Order Flow
Analyzing peak periods can help restaurants identify where operational bottlenecks may occur between ordering, preparation, service, and billing.
Inventory Planning for Peak Demand
Busy periods require the right ingredients to be available at the right time.
Prevent Peak-Hour Stockouts
Running out of a popular ingredient during the busiest service period can affect sales and customer experience.
Historical demand information can provide better context for stock planning.
Avoid Excess Preparation
Preparing too much inventory can increase wastage.
Peak-hour planning should therefore balance expected demand with freshness, food quality, and waste control.
Connect Sales with Inventory
When sales analytics and inventory information work together, restaurants gain stronger context for purchasing and preparation decisions.
Table and Service Capacity Analytics
For dine-in restaurants, peak-hour analysis can also help management understand capacity.
Table Activity
Relevant table information can help restaurants understand when dining capacity is under the greatest pressure.
Table Turnover Context
Table turnover can provide useful operational information, but restaurants should avoid treating faster turnover as the only goal.
Guest comfort and service quality remain important.
Waiting and Service Pressure
Repeated operational pressure during the same periods may indicate the need for better scheduling, preparation, table planning, or workflow improvements.
Peak Hour Sales Opportunities
Peak-hour analytics can also reveal commercial opportunities.
Understand High-Value Periods
Some periods may produce high order volume, while others may generate higher average spending.
Understanding both can improve business planning.
Improve Off-Peak Performance
Analytics can identify quieter periods where appropriate promotions, offers, events, or operational strategies may help attract additional demand.
Protect Peak-Hour Experience
Restaurants should be careful about promotions that create more demand during periods already operating near capacity.
The goal should be profitable and manageable demand, not simply maximum order volume.
Multi-Outlet Peak Hour Analytics
Restaurant chains may have completely different peak periods across locations.
Compare Outlet Demand
One outlet may be busiest at lunch while another performs strongest during dinner.
Centralized analytics helps management understand these differences.
Location-Specific Workforce Planning
Staffing decisions can be based on each outlet's historical operating patterns rather than applying one schedule everywhere.
Outlet-Specific Inventory Planning
Different demand patterns may also require different preparation and inventory strategies.
Consolidated Demand Visibility
Senior management can review broader demand trends while still investigating individual outlet patterns.
Vrajera Peak Hour Analytics
Vrajera Peak Hour Analytics forms part of a broader Restaurant Analytics Software and Restaurant Commerce OS designed around food-business operations.
Connect Sales with Time-Based Analytics
Vrajera can connect relevant POS and billing information with analytics, creating a stronger foundation for understanding hourly sales and order patterns.
Connect Demand with Workforce Information
Where appropriate data is available, peak-hour information can provide context alongside scheduling and workforce planning.
Connect Demand with Inventory
Historical sales and menu demand can be considered alongside inventory, purchasing, recipe, and food-cost information.
This gives restaurants better operational context when preparing for busy periods.
Multi-Outlet Demand Visibility
Restaurant groups can maintain centralized analytics while reviewing individual outlet demand patterns.
Why Restaurants Consider Vrajera Peak Hour Analytics
Vrajera connects time-based sales information with the wider restaurant operating environment.
Instead of simply showing which hour was busiest, owners can investigate how demand relates to orders, menu items, inventory, workforce planning, and outlet performance through one Restaurant Commerce OS.
Conclusion
Restaurant peak hour analytics helps food businesses understand when demand is highest and how those periods affect sales, staffing, kitchen workload, inventory, tables, and service capacity.
The real value comes from using historical demand to prepare operations before the rush starts. Vrajera connects peak-hour analytics with the wider Restaurant Commerce OS, helping restaurant owners turn time-based sales and order information into smarter workforce, inventory, kitchen, and operational decisions.
Frequently Asked Questions
What is restaurant peak hour analytics?
Restaurant peak hour analytics analyzes sales, orders, customer activity, and other relevant operational information by time period to identify busy and quiet restaurant hours.
How do restaurants identify peak hours?
Restaurants can analyze hourly sales, order volume, table activity, customer demand, and historical operating patterns to understand when activity is typically highest.
How can peak-hour analytics improve staff scheduling?
Historical demand provides useful context for planning workforce coverage around busy and quiet periods while helping restaurants avoid unnecessary overstaffing or understaffing.
Can peak-hour analytics help with inventory planning?
Yes. Time-based menu and sales patterns can provide useful context for ingredient preparation, stock availability, and purchasing decisions.
Can restaurant chains compare peak hours across outlets?
Yes. Multi-location analytics platforms can organize time-based demand information by outlet while providing centralized visibility across the restaurant group.
Why choose Vrajera for restaurant peak hour analytics?
Vrajera connects POS, sales, inventory, workforce, menu, and analytics information through one Restaurant Commerce OS, helping owners understand peak demand within broader operational context.