Restaurant Sales Analytics Software for Better Revenue Decisions
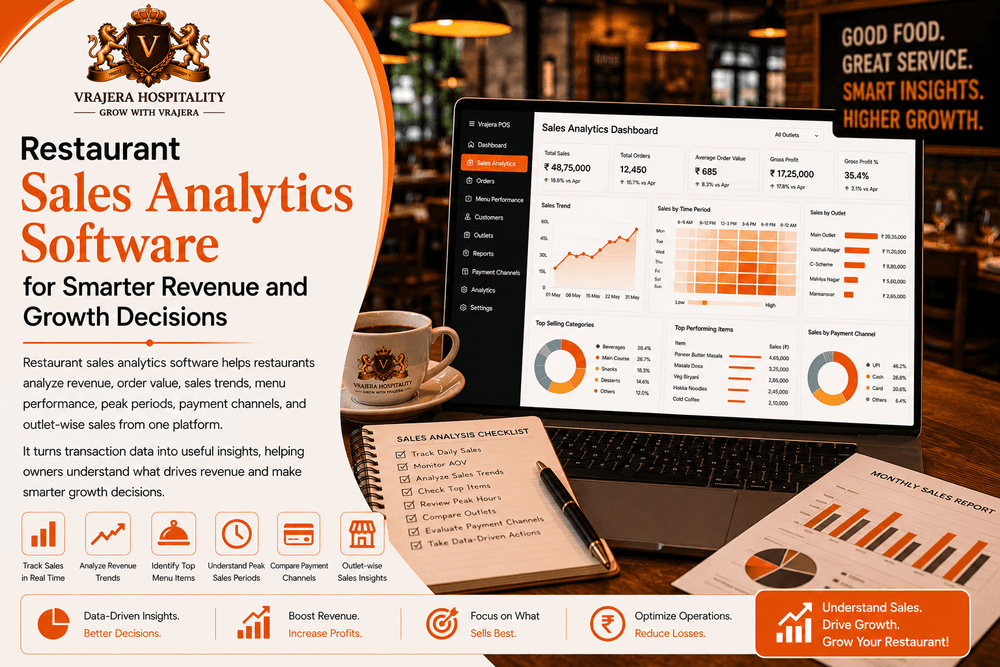
Restaurant sales analytics software helps restaurant owners understand what is happening behind daily revenue numbers.
A POS can show how much a restaurant sold. Sales analytics goes deeper by helping management understand when sales happened, which products contributed, how customer spending changed, and how different locations or channels performed.
This turns transaction data into useful business information that can support menu decisions, operational planning, promotions, and restaurant growth.
What Is Restaurant Sales Analytics Software?
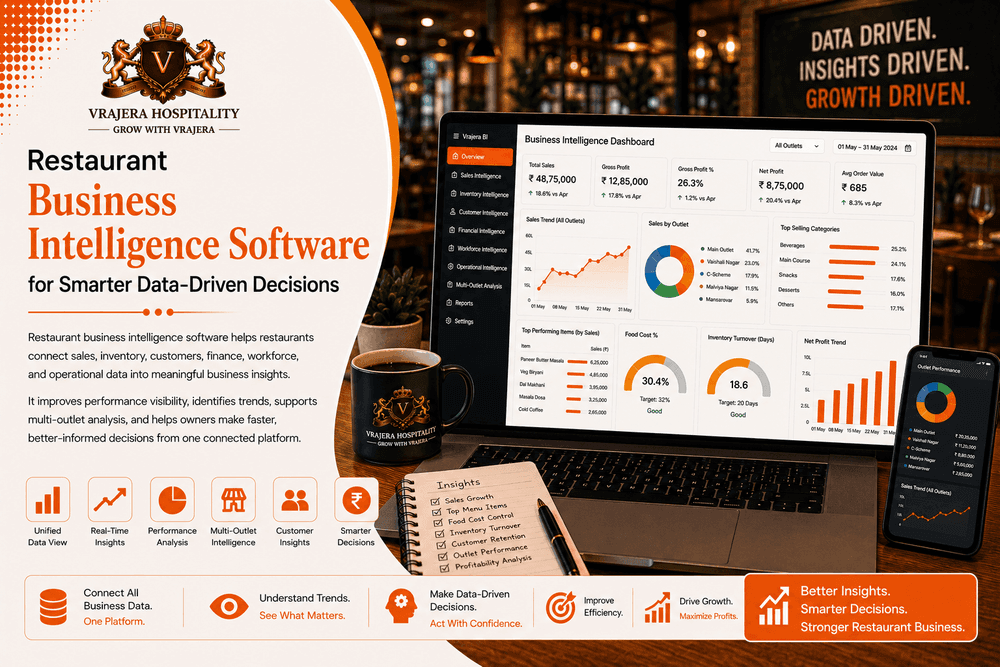
Restaurant sales analytics software organizes and analyzes transaction and revenue information generated by restaurant operations.
Depending on available business data, restaurant owners can analyze:
- Daily sales
- Revenue trends
- Order volume
- Average order value
- Menu item sales
- Sales by time period
- Payment information
- Outlet-wise sales
The goal is not simply to produce another sales report. Useful analytics should help management understand why sales changed and what action may be appropriate next.
Restaurant Sales Reports vs Sales Analytics
| Area | Sales Reports | Restaurant Sales Analytics |
|---|---|---|
| Total Revenue | Yes | Yes |
| Historical Trends | Basic | Detailed |
| Average Order Value | Limited | Analyzed |
| Menu Performance | Transaction Based | Comparative |
| Peak Periods | Manual Review | Easier to Identify |
| Outlet Comparison | Separate Reports | Centralized |
| Decision Support | Descriptive | More Actionable |
Restaurant Revenue Analysis
Revenue analysis provides a clearer picture of restaurant sales performance across different periods.
Daily Sales Analysis
Restaurant owners can review daily revenue to understand normal business patterns and identify unusual changes.
A single day's performance should not always be judged in isolation. Weekends, holidays, weather, festivals, local events, and seasonal demand can influence restaurant sales.
Weekly and Monthly Sales Trends
Comparing revenue over longer periods helps management identify whether sales are:
- Growing
- Stable
- Declining
- Highly seasonal
This provides better context than looking only at today's revenue.
Sales Growth Analysis
Restaurant sales analytics can help management compare relevant periods and understand growth patterns.
Growth should also be viewed alongside profitability because higher revenue does not automatically mean better margins.
Average Order Value Analysis
Average order value helps restaurants understand customer spending per transaction.
What Is Average Order Value?
Average order value represents the average amount associated with a customer order during a defined period.
It provides useful context alongside total sales and order volume.
Understand Changes in Customer Spending
If total sales rise, management can investigate whether growth came from:
- More orders
- Higher average spending
- Menu price changes
- Different product mix
- Other business factors
This gives owners a more complete view of revenue growth.
Use AOV with Context
Increasing average order value should not become a reason to push unnecessary products onto customers.
The goal is to understand purchasing behaviour and improve relevant offers and menu decisions while protecting the customer experience.
Menu Sales Analytics
Menu items do not contribute equally to restaurant revenue.
Best-Selling Menu Items
Sales analytics can help identify products that generate high order volume.
This information can support inventory planning and kitchen preparation.
Low-Selling Items
Items with consistently low sales may deserve review.
Management can investigate whether the issue relates to visibility, pricing, customer preference, seasonality, or menu positioning.
Sales vs Profitability
A best-selling item is not automatically the most profitable item.
Restaurant owners should review sales analytics alongside recipe costs, food costs, and menu margins.
Product Mix Analysis
Understanding which products customers purchase together or across different periods can provide useful context for menu planning.
Sales by Time and Peak Period
Restaurant demand changes throughout the day and week.
Hourly Sales Patterns
Restaurants can review sales by time period to understand when customer activity is strongest.
Lunch and Dinner Performance
For many restaurants, lunch and dinner behave differently.
Analyzing these service periods separately can improve staffing, preparation, inventory, and promotion decisions.
Weekday vs Weekend Sales
Weekend performance may differ significantly from weekday demand.
Recognizing these patterns helps restaurants plan resources more effectively.
Seasonal Sales Trends
Historical analytics can provide useful context around festivals, holidays, tourism seasons, weather changes, and other recurring demand patterns.
Sales Channel Analytics
Modern restaurants may receive orders through several channels.
Dine-In Sales
Dine-in analytics can help restaurants understand revenue generated through on-premise customer activity.
Takeaway and Delivery
Where reliable channel data is available, restaurants can review takeaway and delivery sales separately.
Compare Channel Performance
Different channels may have different order values, costs, customer behaviour, and operational requirements.
Sales should therefore be considered alongside relevant costs before management judges channel performance.
Payment and Transaction Analytics
Payment information can provide additional context around restaurant sales.
Payment Method Trends
Restaurants may receive payments through:
- Cash
- UPI
- Cards
- Other supported payment methods
Understanding the transaction mix can help finance and management teams review daily collections.
Discounts and Adjustments
Sales analytics should consider relevant discounts, cancellations, returns, or other approved transaction adjustments where available.
Cleaner Revenue Visibility
Connecting billing with analytics reduces the need to manually combine sales information from multiple sources.
Multi-Outlet Restaurant Sales Analytics
Restaurant chains need to understand both individual outlets and total business performance.
Compare Outlet Sales
Management can compare relevant information such as:
- Revenue
- Order volume
- Average order value
- Menu sales
- Sales trends
across restaurant locations.
Understand Local Differences
Outlet comparisons require context.
Restaurant size, location, operating hours, pricing, customer demand, and local market conditions can influence sales.
Consolidated Sales Analytics
Senior management can review broader restaurant-group sales while retaining the ability to investigate individual outlet performance.
Vrajera Restaurant Sales Analytics
Vrajera Restaurant Sales Analytics forms part of a broader Restaurant Analytics Software and Restaurant Commerce OS designed around food-business operations.
Sales Data Connected with POS and Billing
Restaurant sales begin with orders and transactions.
Vrajera connects relevant POS and billing information with the wider operational platform, creating a stronger foundation for sales analytics.
Connect Sales with Inventory and Food Costs
Sales numbers become more useful when owners can understand the operational context behind them.
For example, a high-selling menu item can be reviewed alongside inventory consumption, recipe costs, food costs, and profitability.
Connect Sales with Customer Information
Where appropriate customer data is available, CRM information can provide additional context around customer purchasing and repeat behaviour.
Multi-Outlet Sales Visibility
Restaurant groups can maintain centralized sales visibility while reviewing individual outlet information according to management requirements.
Why Restaurants Consider Vrajera Sales Analytics
Vrajera connects restaurant sales information with POS, billing, inventory, CRM, accounting, and analytics through one Restaurant Commerce OS.
This helps owners move beyond topline revenue and understand sales within the broader context of customers, costs, products, and restaurant operations.
Conclusion
Restaurant sales analytics software helps food businesses understand more than how much they sold.
Revenue trends, average order value, menu sales, peak periods, channels, payment information, and outlet comparisons can reveal what is actually driving restaurant sales. Vrajera connects sales analytics with the wider Restaurant Commerce OS, helping owners turn transaction data into clearer business insights and better-informed growth decisions.
Frequently Asked Questions
What is restaurant sales analytics software?
Restaurant sales analytics software organizes and analyzes restaurant transaction data to help owners understand revenue, order values, menu sales, time-based patterns, channels, and outlet performance.
Why do restaurants need sales analytics?
Sales analytics helps restaurants understand what drives revenue, identify sales trends, review menu performance, plan operations, and make more informed growth decisions.
What restaurant sales metrics should owners track?
Useful metrics may include total sales, sales growth, order volume, average order value, menu item sales, time-based sales, channel performance, and outlet-wise revenue.
How does sales analytics help menu planning?
Sales analytics can identify popular and low-selling products. When combined with food cost and profitability data, it provides stronger context for menu decisions.
Can restaurant sales analytics compare multiple outlets?
Yes. Multi-location analytics platforms can organize sales information by outlet while providing consolidated visibility across the restaurant group.
Why choose Vrajera Restaurant Sales Analytics?
Vrajera connects POS, billing, inventory, CRM, accounting, and analytics through one Restaurant Commerce OS, helping owners understand restaurant sales within broader operational and financial context.